Introduction
Lending Club is peer to peer lending company. There are two ways to utilize the services, as a borrower and/or an investor. As a borrower, you can apply for a loan and if accepted your loan will enter Lending Club's loan system. As a investor you can invest into loans that were accepted by Lending Club, whenever a borrower makes a payment the investor will get paid. Lending Club is a great service for both the borrower and investor. As a borrower you can receive low interest rates on a loan, and as an investor you can have high returns on investments.
To learn more about Lending Club, you can visit their website: www.lendingclub.com
As an investor there are many risks involved, one for example is defaulted loans. A defaulted loan is when a borrower forgoes their payments, resulting in a loss for the investor. Usually a investor has a diverse portfolio(100+ loans, minimum $25/loan) to minimize their losses. Also, investors have the option of choosing what type of loans to invest in with Lending Club's filtering system.
 |
| Lending Club's Loan Filter |
Lending Club does an excellent job providing investor's with current and past loan data. They currently allow you to download loan data from 2007 - 2014 and they have an API for the present loan data.
Given a decent sized historical database I wanted to apply some classification methods to determine if a loan will default or not.
For this project, everything was done in R.
Data Processing
I first imported loans from 2007 to 2014. Then I began to remove variables that were useless to the study and not available in the current loan system. For example, "memberid" did not serve a purpose and "totalreclatefee" was not available in the current system's filter.
For next step, I cleaned the data. I removed percentage signs from interest rates and converted them to decimals and binned some variables to lower the factor count. I added new variables for character count, for example there is a variable "emptitle" (employee title) which is written by the borrower. Each borrower has a different title, so I created a new variable that counted the amount of characters inputted by the borrower.
My response variable was the loan status but in the raw file it had 6 factors:
- Fully Paid
- Loan has been fully repaid, either at the expiration of the 3 or 5-year term or as a result of a prepayment.
- Current
- Loan is up to date on all outstanding payments
- In Grace Period
- Loan is past due but within the 15-day grace period.
- Late (16-30 days)
- Loan has not been current for 16 to 30 days.
- Late (31-120 days)
- Loan has not been current for 31 to 120 days.
- Default
- Loan has not been current for 121 days or more.
- Charged Off
- Loan for which there is no longer a reasonable expectation of further payments. Generally, Charge Off occurs no later than 30 days after the Default status is reached. Upon Charge Off, the remaining principal balance of the Note is deducted from the account balance.
The variable was reduced to two factors, "Default" or "No.Default". I decided which statuses were considered "Default" or not based on the probability given by Lending Club. The obvious ones were Fully Paid (P(no.default) = 1) and Charged Off (P(default) = 1). I removed the loans labeled "Current" because there was no way of determining the probability of defaulting based on the data.
 |
| 132,529 Loans of 2007-2014 by loan status (Default or No Default) |
After reducing the loan statuses to two factors, I ended up with 132,529 loans and 30 predictors. Of the 132,529 loans 22% were classified as "Default" and 78% as "No.Default".
Objective
The purpose of this study is to train a model that will accurately predict the loan status and reduce the 22% loss on investments.
Feature Selection
I wanted to narrow down my features and only select the important ones. Random forest has a pretty good feature selection method which ranks the importance of the features. I used 20% of my data set for feature selection to speed up the running of the model.
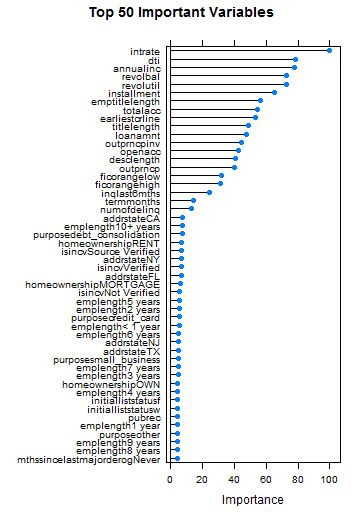 |
| Top 50 important variables by random forest. |
I kept the variables that had greater than 20 importance, anything below that I did not use. As you can see the importance below 20 did not vary much. The most important variable was interest rate with 100 importance, which makes sense because interest rates are high for risky candidates.
Machine Learning
After extracting the 17 important features, I tested my data on four different models, C5.0, C5.0 Cost, GLM, and GBM.
I used 80% of the data as training and 20% as testing. I trained each model with 10-fold cross validation repeated 3 times. I selected best models based on ROC.
 | |
|
The reason why I ran a C5.0 Cost model was to reduce Type II error (False negatives). A Type II error is when it predicts "No.Default" but in actuality it is "Default". In the real world investors will not invest in anything that is predicted "Default" and will only invest in predicted "No.Defaults". So, by decreasing Type II error there will be less risk for an investor, but nothing comes for free. There is trade-off between risk and reward. As the model becomes less risky the reward decreases, hence low risk low return.
Let's look at a hypothetical situation for C5.0 Cost and GBM. An investor only invests $1000 in predicted "No.Default" loans. The annual gain for a "No.Default" loan is 20% and annual loss for a "Default" loan is 40%.
Annual Gain "No.Default" = 20%
Annual Loss "Default" = 40%
Expected Return
[(Investment * Pr(Predicted = "No.Default"| "No.Default") * Annual Gain) -
(Investment * Pr(Predicted ="No.Default"| "Default") * Annual Loss)] *
Pr(Predicted = "No.Default")
C5.0 Cost 10% "Defaults"
($1000*0.90*0.20 - $1000*0.10*0.40)*0.40 = $56.00
GBM 18% "Defaults"
($1000*0.82*0.20 - $1000*0.18*0.40)*0.92 = $84.64
The GBM model has a better return even though there is a higher risk.
Confusion Matrix for Models
C5.0 Trees
Reference
Prediction Default No.Default
Default 1277 1011
No.Default 4463 19754
Accuracy : 0.7935
Sensitivity: 0.22247
Specificity : 0.95131
Pos Pred Value : 0.55813
Neg Pred Value : 0.81571
C5.0 Cost Trees
Reference
Prediction Default No.Default
Default 4631 11092
No.Default 1109 9673
Accuracy : 0.5397
Sensitivity: 0.8068
Specificity : 0.4658
Pos Pred Value : 0.2945
Neg Pred Value : 0.8971
GLM
Reference
Prediction Default No.Default
Default 529 419
No.Default 5211 20346
Accuracy: 0.7876
Sensitivity: 0.09216
Specificity: 0.97982
Pos Pred Value : 0.55802
Neg Pred Value : 0.79610
GBM
Reference
Prediction Default No.Default
Default 1136 862
No.Default 4604 19903
Accuracy: 0.7938
Sensitivity: 0.19791
Specificity: 0.95849
Pos Pred Value : 0.56857
Neg Pred Value : 0.81214
Future Plans
In the future, I plan to invest in loans based on the GBM model. I will measure my performance and tweak the model for better results.
Disclaimer
I am not an investment professional and will not be liable for any loss of profit. Please do your own due diligence before investing.
Code
https://github.com/moyphilip/Lending-Club/